


What do flowers and big data have in common? Quite a lot, it turns out. That is what graduate students of Lina Bouayad, assistant professor of information systems and business analytics, discovered when focusing the power of multiple databasets on the sale of blooms.
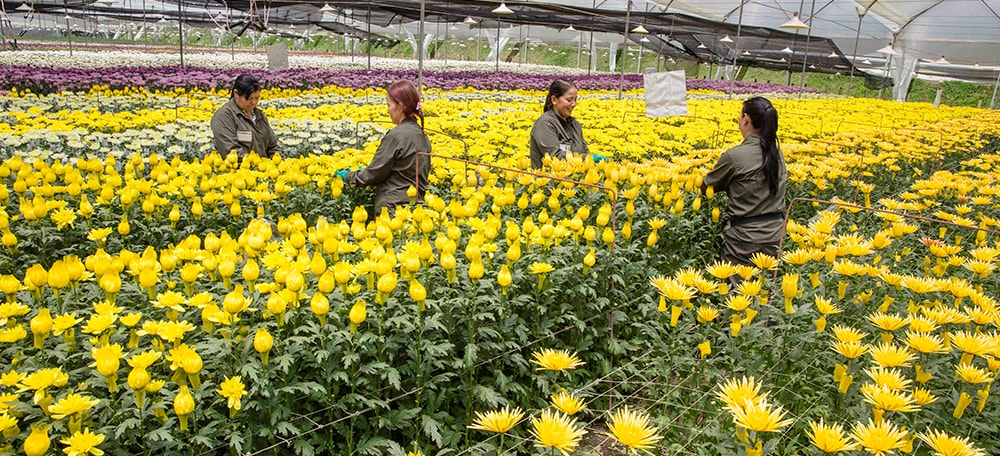
Students in the Master of Science in Information Systems program were asked to find data sets that might help Falcon Farms, a flower business with regional headquarters in Miami, fine-tune its decision-making. For example, when should the firm ship roses, or, should bouquets at one store feature white lilies, while those at another might lean toward blue delphiniums.

“We had to look up all these flowers and see how they are used,” Bouayad said. “Some of the results, conclusions and recommendations were very interesting.”
The blossom investigation was both the program’s capstone project and an ATOM undertaking. ATOM, which stands for Analytics, Technology Consulting and Operations Management, is FIU Business’s first faculty technology consulting service, launched in 2015.
ATOM tackles the challenges businesses are having which might be helped by applying the insights that data analysis provides.
In this project, students were given historical sales data from Flower Farm Inc. and free reign to search out which kind of quantified or quantifiable information might correlate with flower demand rise-and-fall.
At issue: the company was using historical sales data to forecast future sales. But its 80 percent accuracy rate needed fine-tuning. Flowers are highly perishable, and a miscalculation might mean products wilting on the shelves and revenue that couldn’t be recouped, Bouayad explained.
Bouayad encouraged students, divided up into teams of four or five, to think innovatively when seeking information. Datasets selected and scraped online by the students included stock market prices, oil prices and snowfall in Alaska (one of the farm’s markets). Other datasets included information gleaned from governments, such as employment data, and recorded marriages, births and deaths.
Students also brought in Twitter data, which revealed likes and dislikes.
Merging the proprietary sales data and external data.
At project’s end, the students presented their conclusions to the flower farm’s owner. For example, the team that correlated the Dow Jones average with sales saw a sales increase eight days after a stock hike – just about how long it takes for gains to be realized in many investor accounts. And the Alaska data showed that heavy snowfall meant decreased sales as people stayed off the roads.
Falcon leadership was impressed with what the students achieved. “It is critically important to forecast sales – what you put into the store gets sold or thrown away,” said Felipe Arango, director of new business development at the company. “The students were very curious and intuitive about what could be explanatory variables.” What proved most useful, he said, was the correlation of sales data with weather conditions. “We have integrated it into our model. So far it has proven very useful.”
The project also marked the first time students on an ATOM project had presented remotely.
“Thanks to the current technology, the process went very smoothly,” Bouayad said. “The client had a split view of the slides, and the students presenting. He was able to ask questions and provide comments after each presentation.”
“They were so motivated,” Bouayad said of the students. “They were really engaged.”
One of those students was Guillermo Planos, founder of software company, Webvoz, which allows for the sonic transfer of data, a new and upcoming technology.
“It was fantastic,” said Planos about the project. “We basically searched for causality, that is where the brainstorming came in.” Using public census data, his team correlated neighborhoods, county fairs and events schedules, store locations and even age, income and ethnicity with sales.
The more data that is obtained, Planos said, the better algorithmic predictions would become. Traditional methods – just looking at historical sales data – is like driving a car and only looking in the rear view mirror, he said. But with today’s data analytic methods, “one can see what is coming around the bend.”
Planos said that the remote presentation kept everyone’s attention. “We knew that the full collaborative resources of (the classroom) were playing in orchestrated synchronization,” he said, adding that audio and visual blending created a compelling experience.
In the end, the project, he said, showed “how external data analysis could bring insights to decision making for products as simple as flowers sold in a supermarket.”